
Aviation Optical Design, Color & LED Matching
Optical tolerancing, spectral transmission, chromaticity, LED matching, stray light, and prototype validation for aviation optics.
Optical input and acceptance matrix
Translate the system target into measurable component controls, then retain complete-fixture acceptance for the result created by the source, optic, housing and operating condition together.
| System input | Glass-component control | Complete-fixture acceptance |
|---|---|---|
| Beam distribution | Optical profile, prism angle, refractive index and mounting datums | Isocandela map, boundary intensity and prohibited-sector output |
| Color and spectrum | Source spectrum, filter curve, thickness, temperature and incidence angle | Chromaticity coordinates and intensity inside the required regions |
| Optical throughput | Spectral transmission, reflection, absorption and scatter | Output and efficiency inside the useful beam |
| Stray light | Edges, masks, roughness, coatings and internal reflection controls | Prohibited sectors, stray lobes and glare |
| Production tolerance | Glass melt, refractive index, geometry and surface error | Production beam, color and unit-to-unit consistency |
| Configuration change | LED bin, glass, coating, tooling and assembly changes | Impact assessment and necessary re-verification |
Prototype-to-production validation flow
- Freeze the source, operating point and beam or color target.
- Build the nominal optical model.
- Analyze geometry, index, thickness, LED-bin and assembly tolerances.
- Produce production-representative samples.
- Measure component spectrum, geometry and surfaces.
- Measure beam, chromaticity, intensity and stray light in the complete fixture.
- Retest after the required environment, then freeze drawings, approved samples and change controls.
Optical Design, Color and LED Matching
Beam shape and signal color emerge from a system: the source spectrum and position, glass geometry, filter response, coating, housing, and operating temperature all contribute. This is why changing an LED bin or replacing a molded lens with a visually similar part can alter a result that previously worked. The chapter builds a practical picture of those interactions before turning to photometric, colorimetric, and source-specific checks.
Photometric quantities and beam charts
Use the quantity that matches the lighting task and record the measurement geometry. The BIPM principles governing photometry provide the SI foundation.
| Quantity | Unit | Question answered | Typical aviation use |
|---|---|---|---|
| Luminous intensity | cd | How much visible light is sent in a stated direction? | Runway lights, position lights and PAPI |
| Illuminance | lx | How much light arrives on a stated surface? | Landing lights, inspection lights and reading lights |
| Luminance | cd/m² | How bright does a source or surface appear in a direction? | Signs, diffusers and displays |
| Isocandela map | angle + cd | How is intensity distributed across the observation field? | Complete aviation signal-light acceptance |
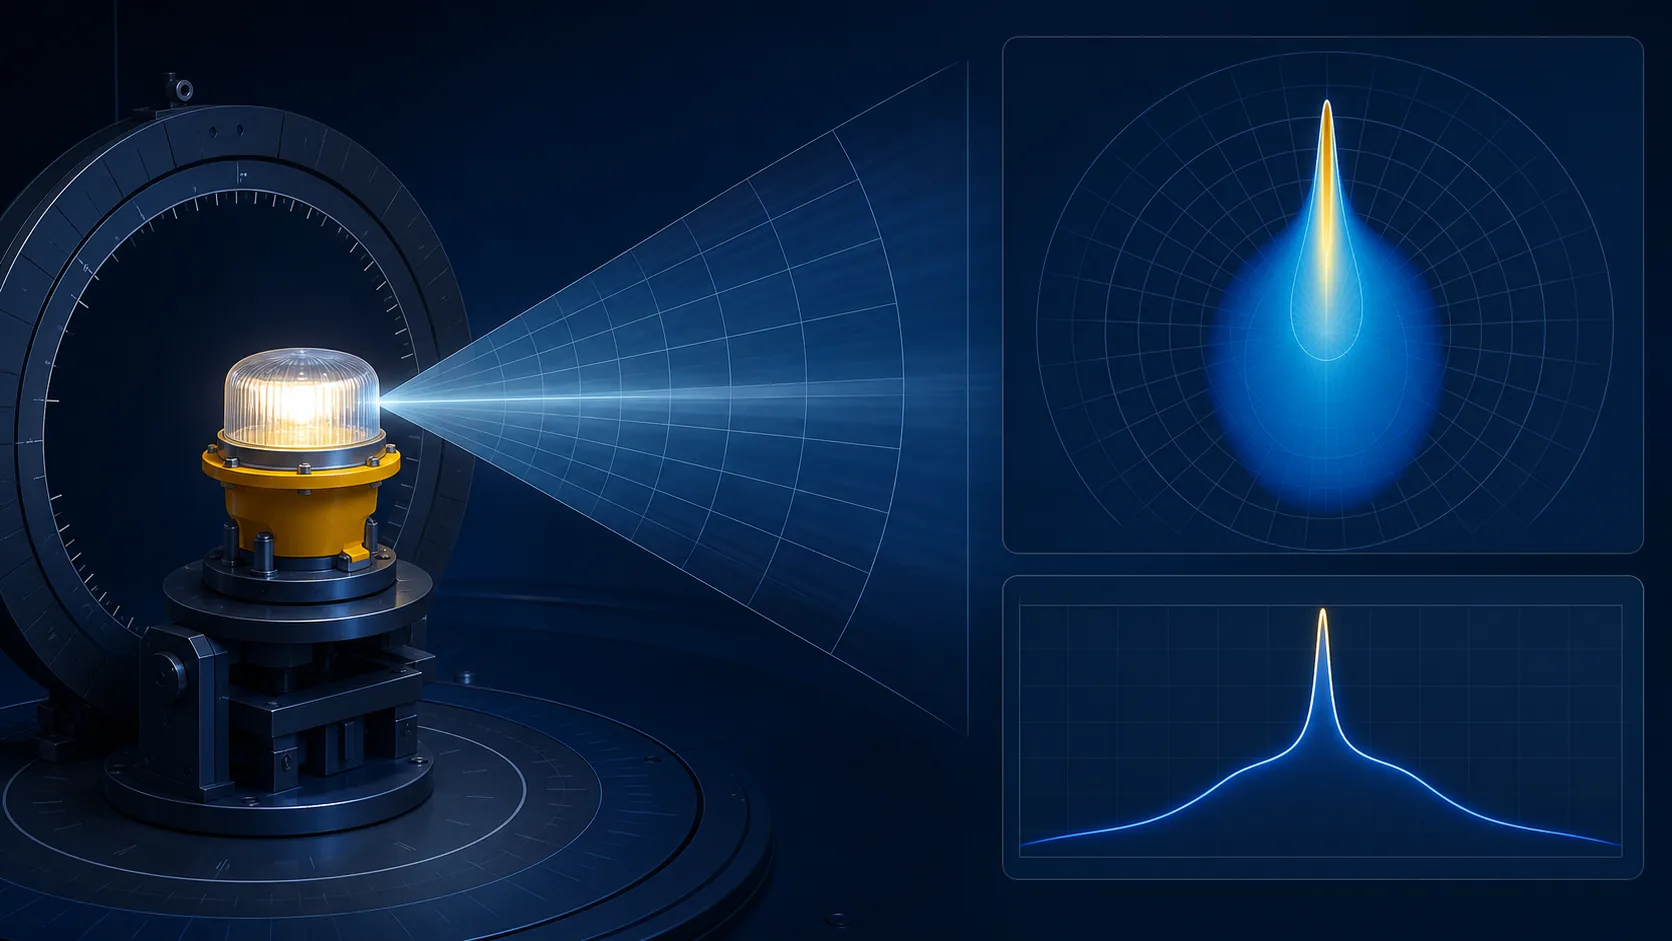
A single commercial beam angle cannot describe an aviation signal. Equipment requirements commonly control minimum, average or point intensity inside defined angular regions and may limit output outside them. Provide the target isocandela map, coordinate convention, fixture datum and source configuration. Accept the complete light by its required angular distribution, including boundaries, weak corners, hot spots and prohibited lobes.
Photometric reports should identify the complete fixture, source, drive setting, stabilization time, measurement distance, angular step, detector aperture, alignment datum, ambient condition and calibration status. Record whether the reported value is a point, average, minimum, maximum or integrated result. These details prevent a component transmission number, a peak candela value and a required regional intensity from being compared as if they described the same thing.
Distance and geometry must match the selected quantity. Illuminance changes with measurement plane and distance; luminance depends on viewing direction and apparent emitting area; luminous intensity requires a valid far-field or otherwise defined arrangement. LED spectra can also create photometer spectral-mismatch error. Use calibrated instruments appropriate to the source and preserve raw angular data for later configuration comparisons.
How does a glass prism redirect an aviation light beam?
- A prism redirects light because rays change direction at interfaces between materials with different refractive indices. The amount of deviation depends on surface angles, refractive index at the wavelength, and incidence angle. Total internal reflection may also be used when geometry keeps a ray above the critical angle. Multiple surfaces can collimate, spread, or turn the beam.
- Real parts differ from ideal ray models. The source has finite size; molded corners are rounded; glass index varies with wavelength and temperature; surfaces have roughness; and the housing clips rays. Colored glass changes the spectral weighting, so perceived beam direction and intensity can differ by color. Assembly tolerances add source decenter and prism tilt.
- Use material dispersion data and production-representative geometry in simulation. Add tolerances and perform Monte Carlo or sensitivity analysis. Prototype the optic in the full fixture and compare measured isocandela plots with the model. If disagreement is systematic, update assumptions for mold shrinkage, surface form, source model, or index rather than compensating blindly in the prism angle.
Transmission and spectral specification
Component transmission is measured for defined glass, thickness, finish, coating, wavelength and angle. Complete-fixture efficiency also includes the source, reflector, masks, housing, temperature, electronics and light outside the useful beam. Catalog or coupon transmission is therefore one input to the loss budget—not proof of useful fixture output.
Specify finished-part transmission, reflection or absorption over the wavelength range that matters, then verify intensity and distribution in the configured light. For example, a component transmitting 90% of the weighted source spectrum followed by an optical path placing 80% of that light into the useful region yields only 72% before angular acceptance is applied. A higher-transmission cover can still produce a worse fixture if its geometry, masks or scatter send more energy outside the required beam.
Measure representative finished geometry rather than relying only on a thin polished material coupon. Curvature changes incidence angle and path length; coatings can change with angle and polarization; surface texture, molded edges and masks add loss or scatter. Separate total transmitted energy from energy delivered into the required angular region. For non-lighting imaging or sensor windows, use the separate Cockpit Display Glass & Aerospace Optical Windows guide.
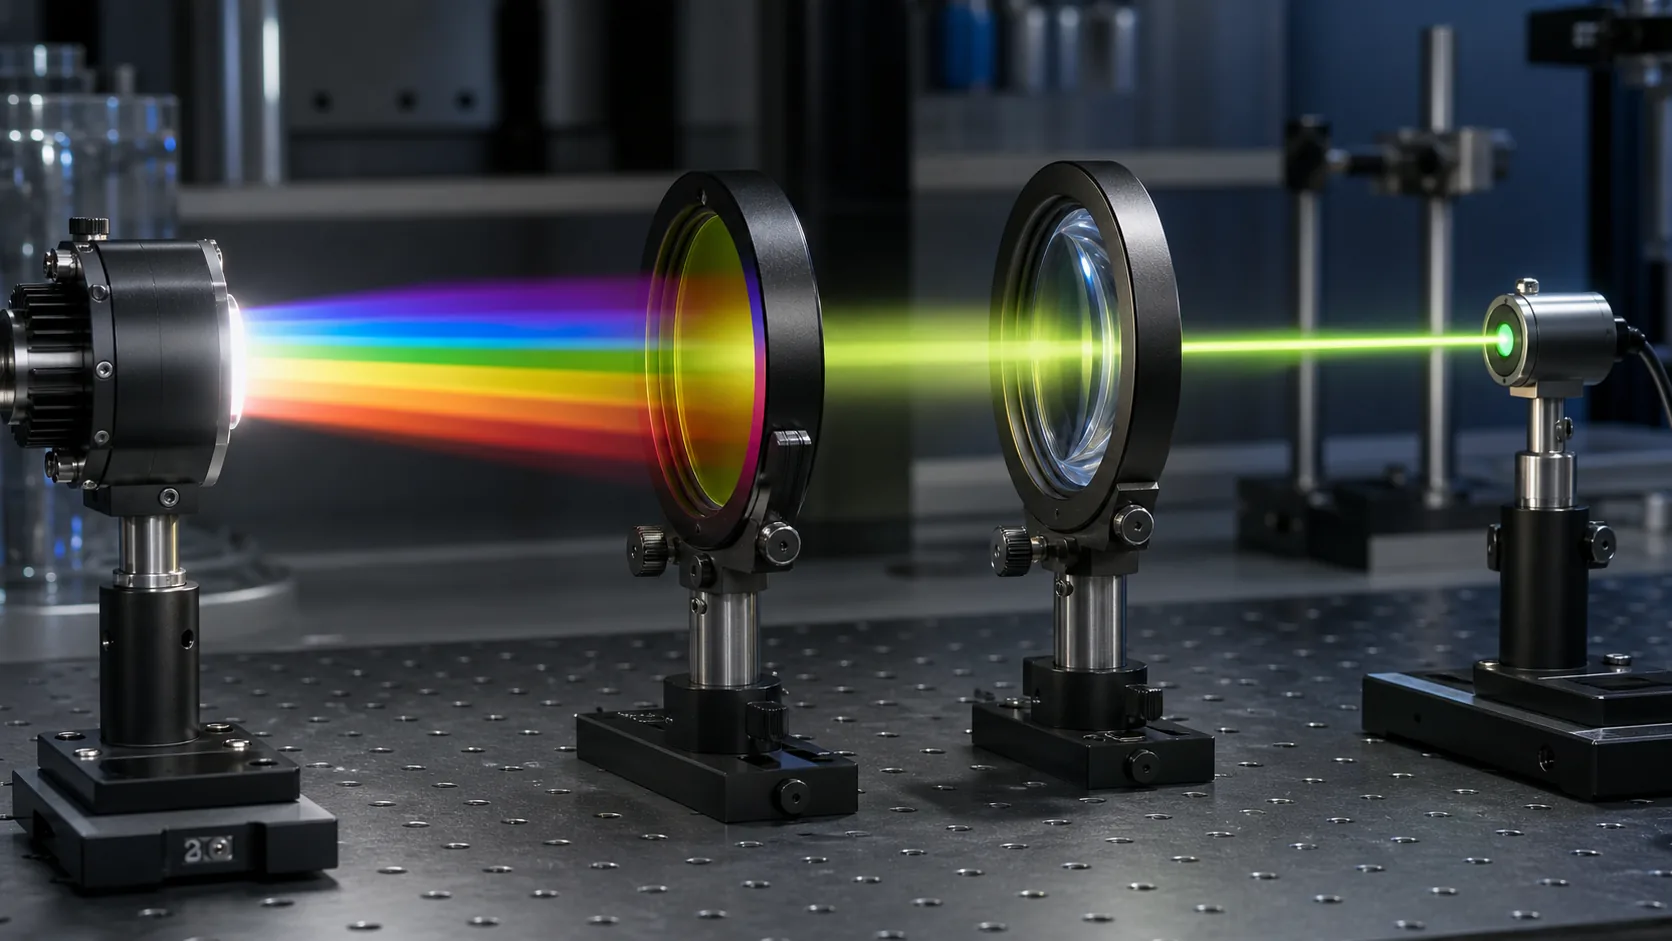
One weighted visible-transmission value can hide wavelength differences that move aviation color or reduce output with a narrow-band LED. Colored filters require the full transmission curve because both the passband and blocked region influence chromaticity and available intensity. White-light optics can also shift appearance when blue or red energy is attenuated unevenly.
Record wavelength range and interval, source spectrum, incidence angle, polarization where relevant, thickness, temperature, surface treatment, measurement aperture and whether data represent raw material or the finished optic. Define average or minimum passbands and required blocking only where they follow the system need. Use full spectral data during development; selected production wavelengths are acceptable only after correlation shows that they detect meaningful material, thickness or coating variation.
Glass thickness, color and LED source matching
Absorbing colored glass changes spectral transmission with optical path length. Finished domes, filters and prisms can therefore show color and intensity variation with thickness, curvature and observation angle. Evaluate minimum and maximum production thickness using the intended source rather than approving a differently shaped flat coupon.
An approved LED configuration includes manufacturer, type, permitted bin, spectrum, drive condition and relevant temperature range. A family name alone does not control the spectral change at a filter edge. Confirm the combined source-and-glass result inside the complete fixture and treat changes to LED bin, glass melt, thickness, coating or supplier as configuration changes.
| Variable | Record for development and acceptance |
|---|---|
| LED | Manufacturer, type, bin, spectral distribution, drive current and operating point |
| Temperature | Ambient condition, LED junction-temperature proxy and glass or filter temperature |
| Glass | Material melt, thickness range, orientation and effective optical path |
| Measurement | Standard observer, chromaticity system, spectral range, angle, aperture and instrument |
| Complete fixture | Chromaticity, intensity, viewing sector, dimming state and environmental condition |
| Change control | Review after LED bin, filter, thickness, coating, tooling or supplier change |
CIE 015:2018 supplies general colorimetric methods. The applicable FAA, SAE or program equipment requirement defines the aviation color boundary and complete-fixture acceptance.
Validate the corners of the approved configuration rather than only a nominal sample: permitted LED-bin extremes, minimum and maximum filter thickness, cold and hot operation, dimming states and angular sectors where the optical path is longest. Chromaticity and intensity must be assessed together because increased saturation can consume output margin.
State whether results represent the source, loose filter, subassembly or complete fixture. Record the required observer and coordinate system, spectral range and interval, integration or averaging rule and measurement uncertainty. Correlate production melt certificates, thickness checks or selected spectral wavelengths with complete-fixture results and retain periodic system verification.
A PAPI transition requires its own source-filter-lens and angular acceptance controls; use the PAPI Lenses, Filters & Optical Components guide rather than treating this general color table as a complete PAPI specification.
What causes stray light in aviation fixtures?
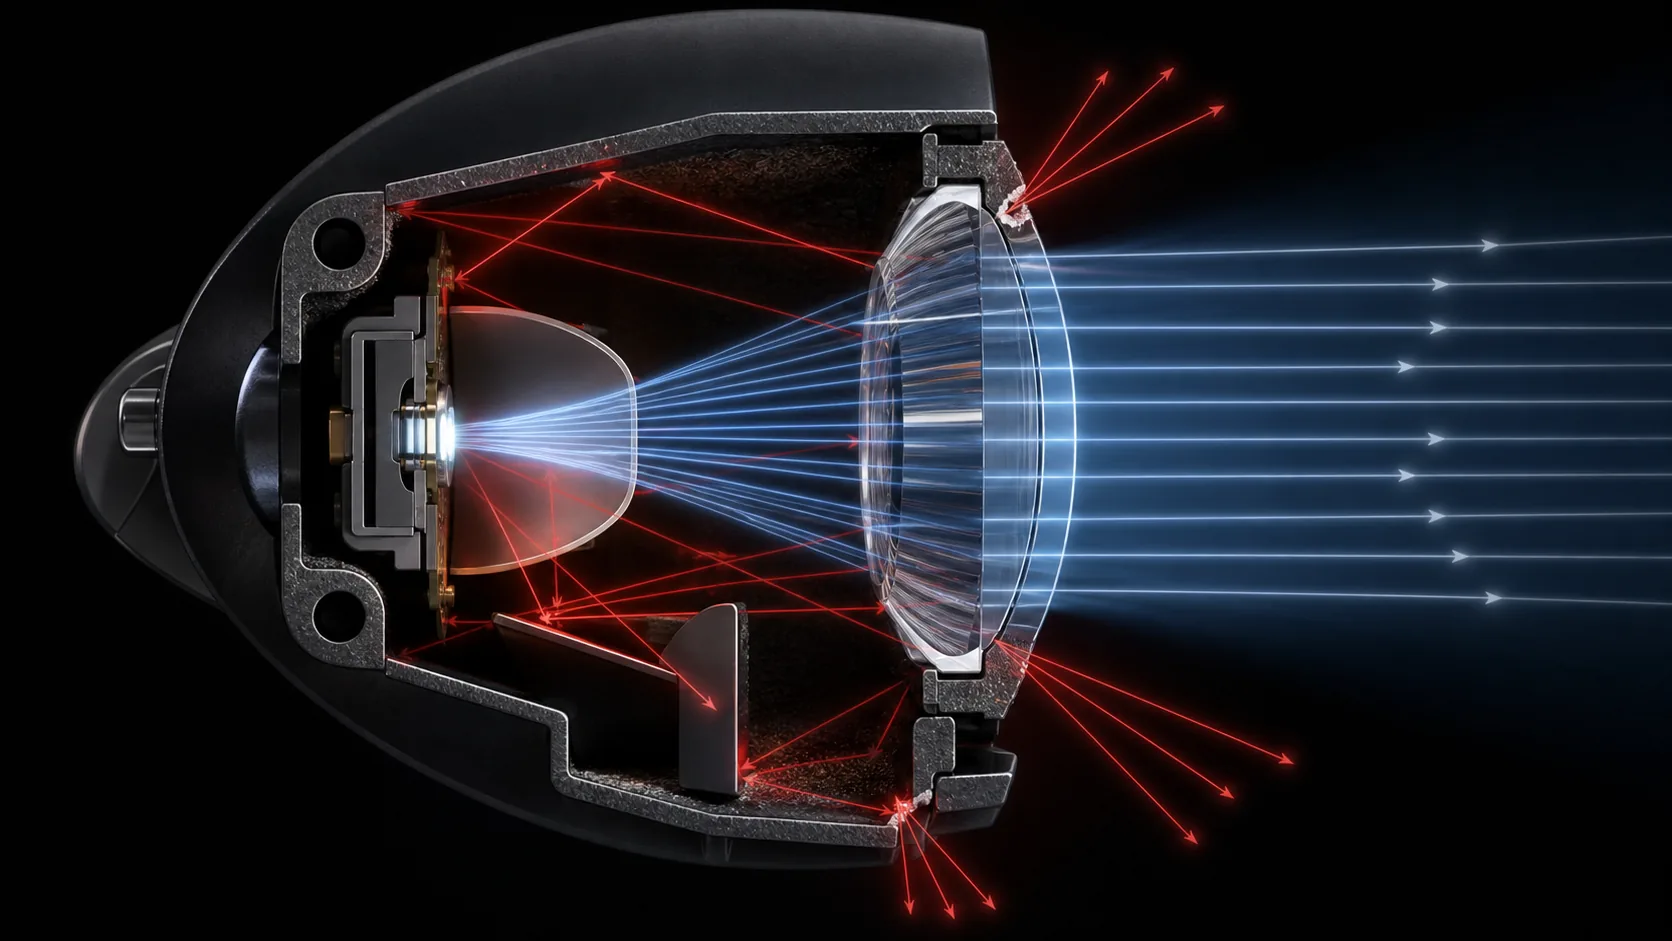
Stray light comes from rays that reach the observer through unintended paths: reflections between glass surfaces, scatter from roughness or contamination, leaks around masks, bright lens edges, housing reflections, coating ghosts, or direct view of the source.
Mold flash and transparent sealant can also transmit light into forbidden sectors.
It can reduce signal contrast, create glare, blur a PAPI transition, illuminate the wrong airfield sector, or create cockpit reflections. A fixture can meet peak intensity yet remain unacceptable because of an unwanted lobe outside the main beam.
Use non-sequential optical analysis with realistic surface reflectance and scatter. Blacken or mask nonfunctional regions with qualified materials, control glass edges, and avoid parallel reflective cavities. Inspect prototypes in a dark environment from many angles, then measure the relevant off-axis regions. Environmental testing matters because scratches, haze, and coating damage increase scatter. A cosmetic black coating must be assessed for adhesion, heat, outgassing, and fluids before it becomes part of an aerospace optical control.
How should a diffuser be specified for aviation lighting?
Specify total and diffuse transmission, haze, angular distribution, color, uniformity, surface orientation, useful aperture and masked zones. Haze alone is insufficient because equal haze values can produce different angular distributions. Evaluate production-representative diffusers with the intended source spacing, air gap and viewing geometry, then approve measured limits and boundary samples.
Total transmission describes all transmitted light, while diffuse transmission and angular distribution describe how much is redistributed and where it goes. A strongly scattering surface may hide LED images but reduce useful efficiency, widen light into unwanted regions or change color. Source pitch, mixing distance, reflector or light-guide geometry and texture uniformity should therefore be developed together.
Define which side carries an etched, frosted, molded, coated or blasted texture because orientation can alter appearance and cleaning behavior. Include approved cleaners, abrasion, contamination and environmental durability when the texture is exposed. Application-specific comfort, sign-uniformity and installed-light requirements belong in the Aircraft Exterior & Cabin Lighting and Airfield Ground, Elevated & Special Lighting guides.
Homogeneity, roughness and optical scatter
Optical homogeneity describes refractive-index variation within glass. Most visible aviation-lighting covers and molded prisms should be controlled first for beam, color, geometry and defects; imaging-grade homogeneity is justified only when system analysis shows that bulk index variation affects the required light distribution. Premium homogeneity grades can add material, melting, blank-selection and inspection cost without improving an illumination optic.
If homogeneity is functionally required, state grade or allowed index variation, wavelength, aperture, orientation and whether acceptance applies to a blank or finished part. Treat striae separately when directional index structures can influence the beam. Confirm that forming and heat treatment preserve the needed result. Keep detailed camera, laser and sensor-window requirements in the optical-windows guide.
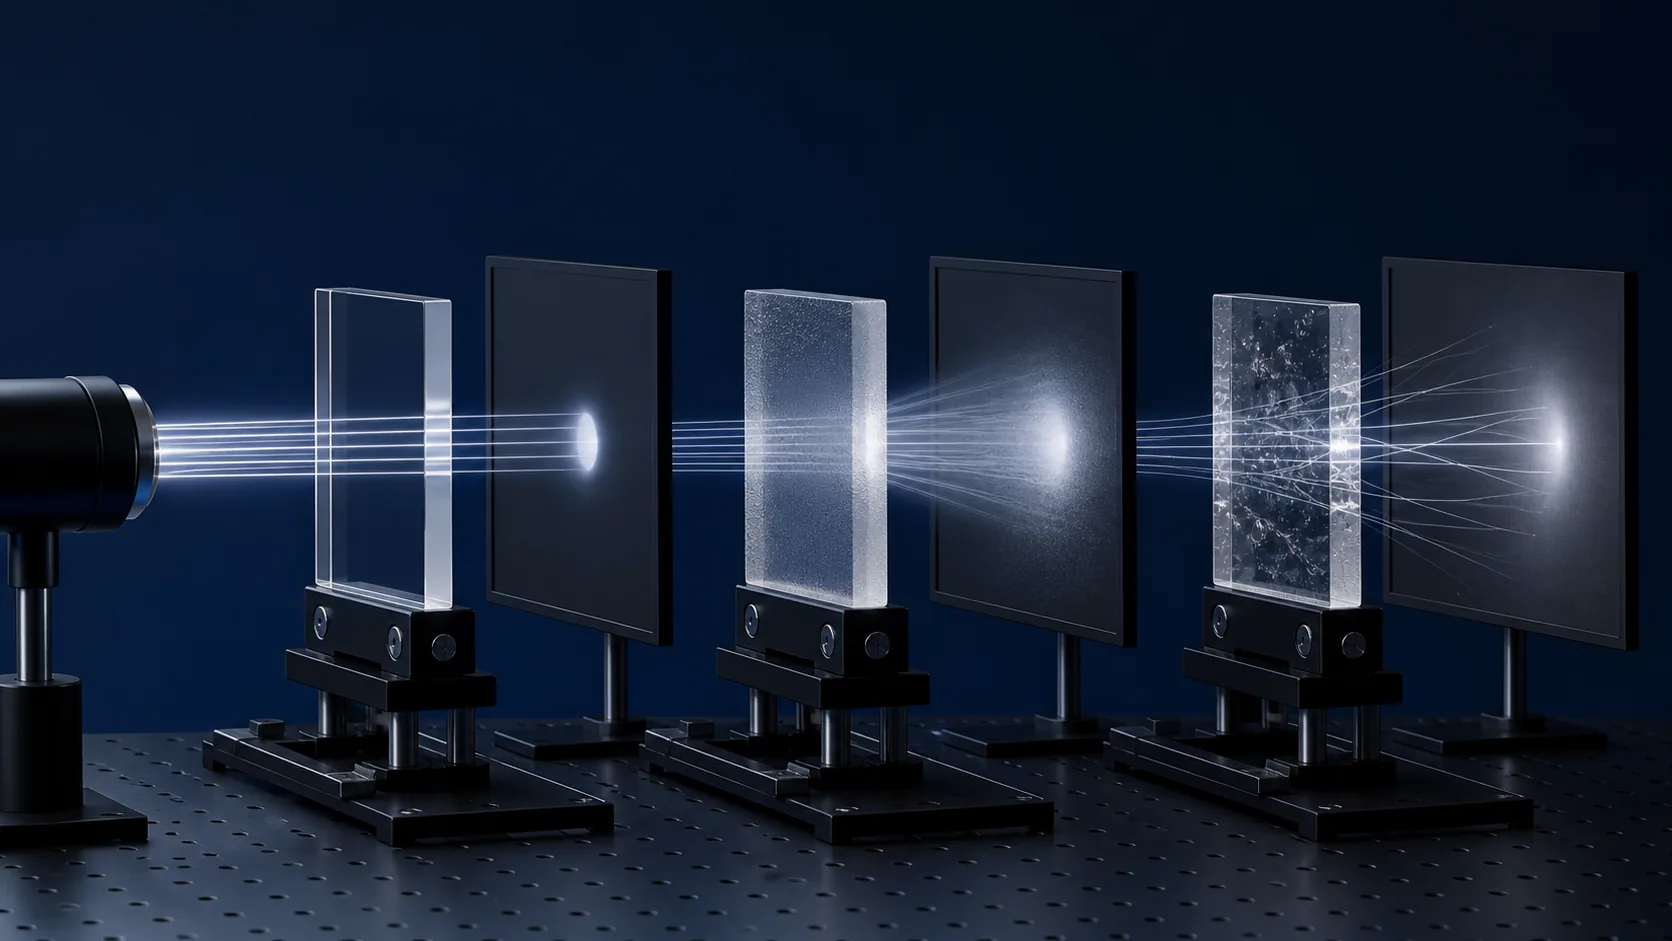
Microscopic roughness scatters light, reducing peak intensity and filling unintended angles. Macroscopic waviness is a different form error that redirects the beam, while deliberate texture is a designed diffuser. A small arithmetic-roughness trace cannot by itself predict scatter across a full optical aperture.
State measurement scale, instrument, cutoff, aperture, surface state and location when roughness is used as a process control. Molded, fire-polished, ground and coated surfaces have different signatures. Specify functional scatter, haze, contrast or beam performance first, then correlate surface metrology with the intended result and repeat the relevant optical test after abrasion, cleaning or environmental exposure.
Refractive index, tolerance allocation and production cost
Allocate tolerances from complete-system sensitivity rather than applying the tightest possible value to every feature.
| Variable | System effect | Recommended control |
|---|---|---|
| Refractive index | Beam deviation and center position | Melt evidence and first-piece optical verification |
| Dispersion | Wavelength-dependent beam deviation | Material data at relevant wavelengths |
| Prism angle | Beam direction and angular boundaries | Functional geometry and beam-deviation measurement |
| Surface error | Scatter, beam change and stray light | Surface control correlated with system performance |
| Noncritical dimensions | Manufacturing cost with little optical benefit | Limits based on stable process capability |
Refractive index varies with wavelength and temperature, and different melts or nominally equivalent glass families can have different controlled ranges. Include relevant index and dispersion data in the tolerance model. For critical molded prisms, retain melt identity and correlate certified material data with first-piece beam deviation or complete-fixture photometry. A supplier substitution can require tool compensation or optical redesign even when density and visual appearance are similar.
An alternative glass must be reviewed for index, dispersion, transmission, color, thermal expansion, chemical durability, forming and strengthening—not matched by family name alone. Rank geometry, material, source and assembly variables through sensitivity analysis; tighten contributors that consume beam or color margin and relax features with no measurable system benefit.
Tight limits increase tool precision, inspection time, scrap and supplier risk; loose limits can increase adjustment, photometric failures and field variation. Use functional gauges or optical tests when they control several interacting dimensions more efficiently than separate measurements. Review capability after production-representative prototypes and center critical tolerances within a stable process rather than at its physical edge.
Annual volume, tool wear, cavity differences, measurement uncertainty and acceptable yield belong in the tolerance decision. Design fixture adjustment only where it is stable, measurable and maintainable. Changes to material, melt range, tool, coating, LED or assembly datum require documented impact review and the appropriate component or complete-fixture verification.
Measurement evidence for optical specifications
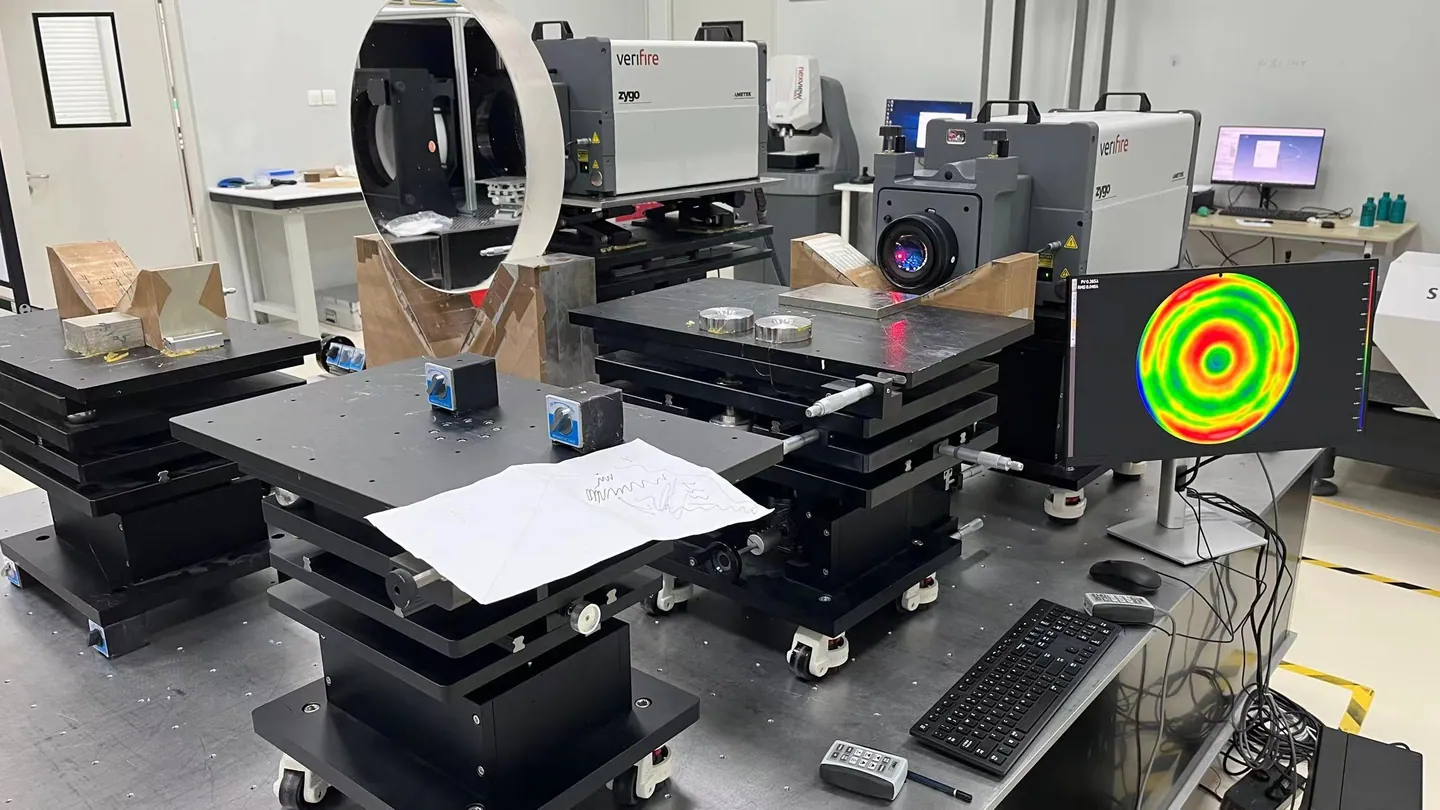
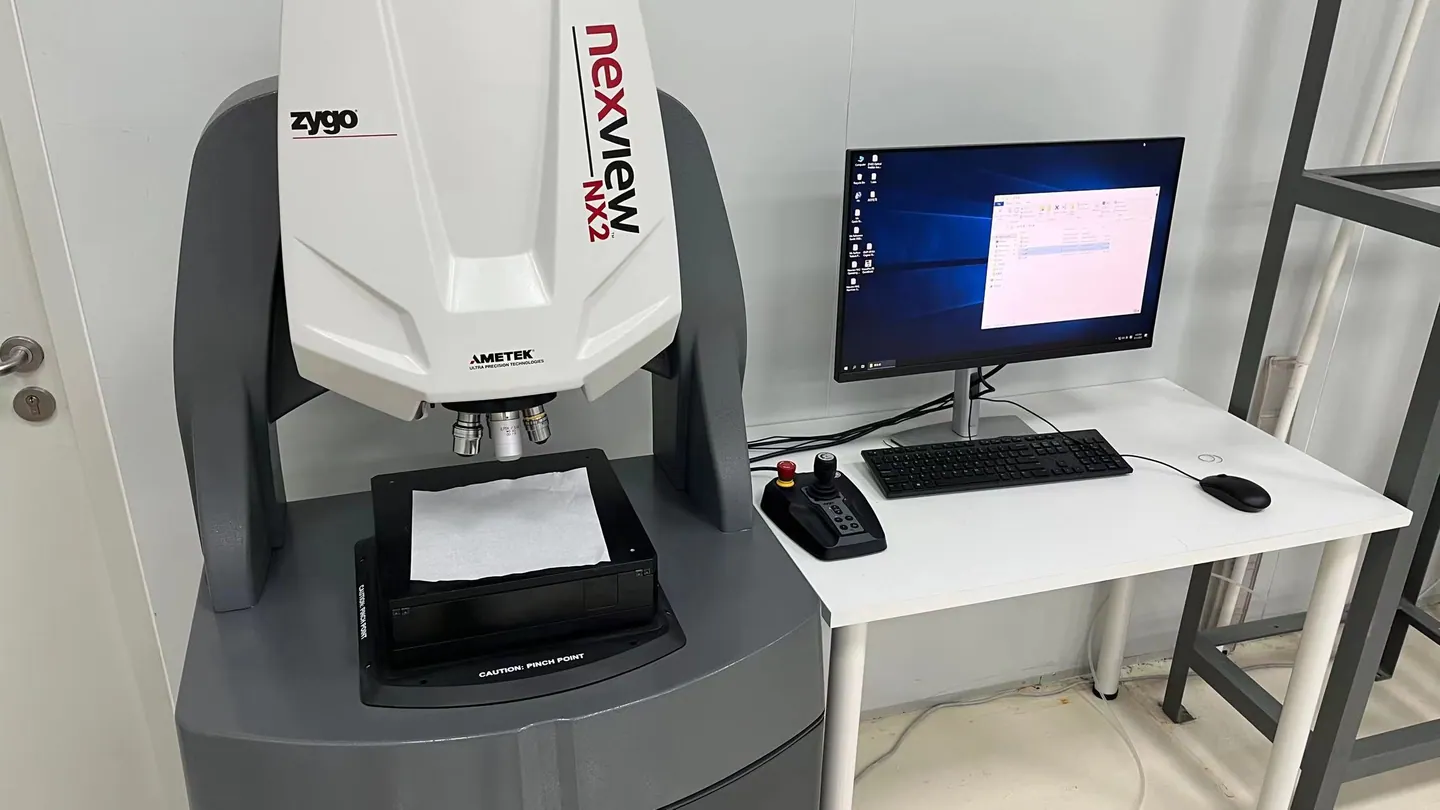
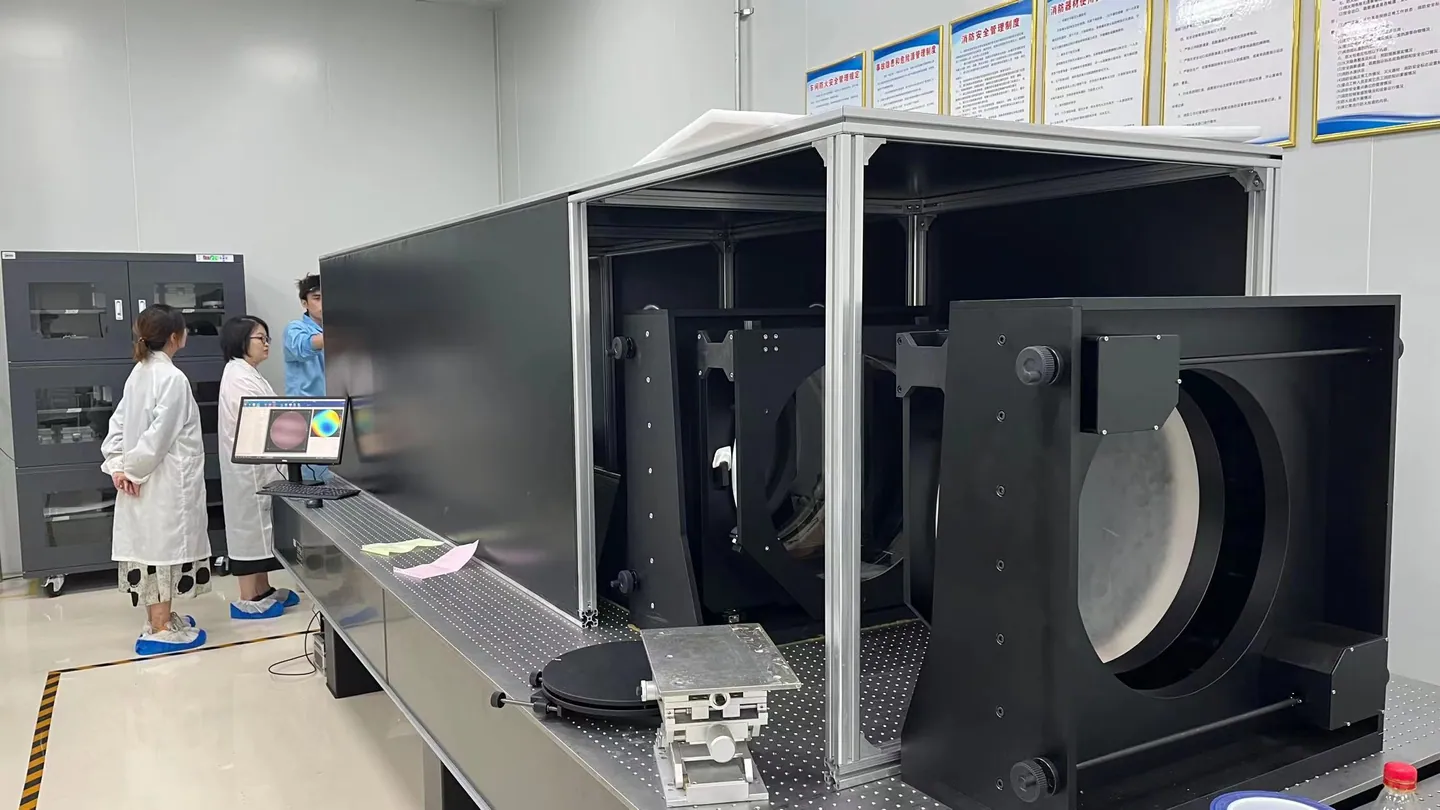
Equipment photographs are useful evidence that a measurement route exists, but they are not a tolerance statement or an inspection report. The drawing and control plan must still identify the measured characteristic, test method, aperture, datum, mounting state and acceptance limit.
| Measurement route | Typical engineering use | What the report should state |
|---|---|---|
| Interferometry | Surface form, power, irregularity or transmitted wavefront, according to the optical setup | Equipment and reference, wavelength, aperture, datum, fixture, analysis convention, result and limit |
| Optical profiling | Localized 3D topography, step height or surface-texture evaluation | Objective, scan area, lateral and vertical settings, filtering, parameter definition and repeatability |
| Large-aperture inspection | Evaluation of larger optical surfaces or transmitted optical behavior | Test geometry, supported area, environmental controls, calibration status and uncertainty appropriate to the decision |
Official and standards references for this guide
Source status was reviewed on August 12, 2026. The contract, certification basis, approved equipment configuration and controlled document revision determine actual applicability. Obtain authorized copies of paid standards.
- FAA, AC 150/5345-46F for application-specific airfield-light beam, color and fixture requirements.
- FAA, AC 150/5345-28H for PAPI optical, color and transition requirements.
- SAE International, AS25050B for aeronautical-light color and light-transmitting-ware requirements where incorporated by the program; SAE lists it as reaffirmed in September 2022.
- BIPM, Principles governing photometry, and CIE, CIE 015:2018 - Colorimetry, for measurement foundations. The applicable aviation equipment specification defines the color boundary and acceptance.
- ISO, ISO 10110-1:2019 and ISO 10110-5:2026 for selected optical drawing and surface-form controls; they do not define aviation-light color or complete-equipment qualification.
Contact Us
Your feedback fuels our growth, and your questions drive our solutions.
We value your feedback, inquiries, and suggestions. Please feel free to get in touch with us
General inquiries
Please contact us via sales@bo-glass.com, and we will reply to you as soon as possible.
Interested to work with us
Drop your resume at info@bo-glass.com
and we will get back to you shortly.
We uses the contact information you provide to us to contact you about our relevent content, products, and services.